26.04.2022
Look More, See More
The beauty of golf data is the more we look at it, the more there is to see. Here are some examples of how looking deeper into stats reveals greater detail about what's going on.
What I didn't anticipate in the early days is that numbers, fractions and percentages can be a blind spot for some of us. I should have known this, my wife and I have been test-driving each other for over a third of a century and our youngest is, like her mum, a total number-numpty (sorry girls but as you know, you're better at the more important things in life)!
Where some see fog and a total mess in numerals...
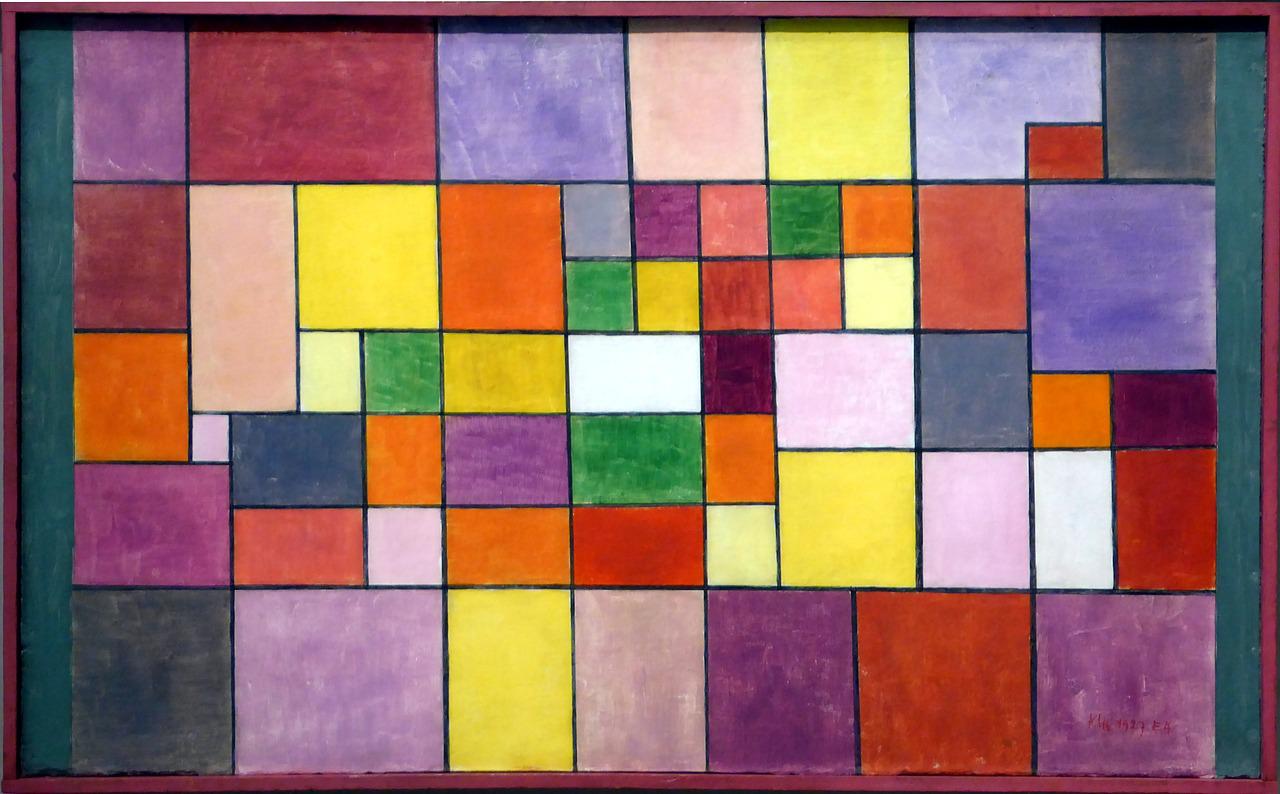
 others see colours and patterns in numbers: -
 Actual case examples below to illustrate our "direction of travel" and how letters (like a school report card) will supplement our existing numerical data outputs.
Example 1:
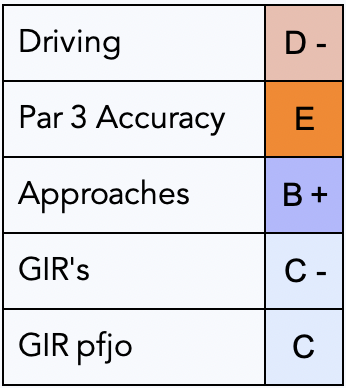
When we review these stats, we might be forgiven for thinking that slightly above average GIR's are being held back by less than average tee shots: -
Only when we look deeper into the Approaches numbers, we see a bigger picture: -
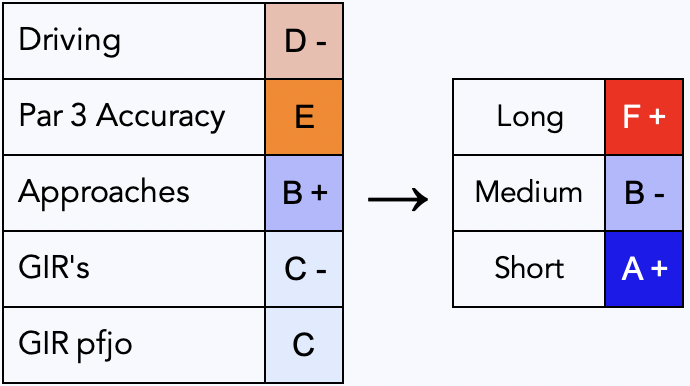 In this example, the golfer is hitting an excellent number of greens with her Short Approaches and a good proportion with her medium irons. It's been her longer irons (and Rescues and 3 Woods) that haven't been getting close enough. When we examine the Par 3 section on GDL, we shouldn't be surprised to see a similar pattern: -
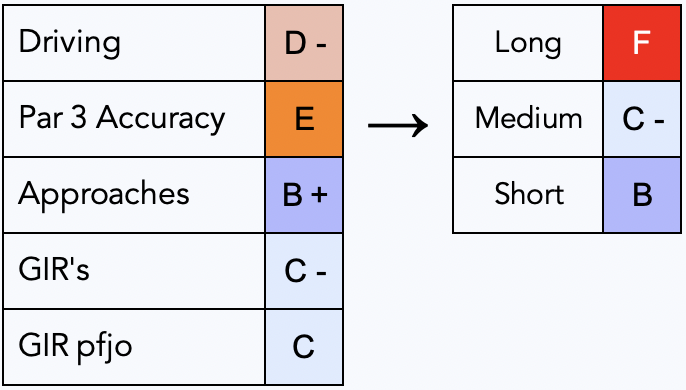 We know that the average approach is 45 yards shorter than the average par 3 length and for every elite junior, scratch amateur and professional, they play most of their approaches with the short clubs, the 9 irons and wedges. Given the Par 3's being "not good" as well as the long approaches being "poor", the suggestion is firmly that the longer clubs are the primary area for focus in her long game, tee-to-green.
Our performance rankings are calibrated for each "level" in golf. From the recent database-mining analysis, we have already factored in the actual percentages that we can expect for the Long, Medium and Short club categories (both at par 3's and for approach shots) and the composition and proportions of each club used will naturally influence the overall percentages and rankings.
Interestingly, there are some unexpected numbers that look like anomalies at first glance. For example, the European Tour (now DP World Tour) average driving accuracy is worse than the Challenge Tour and even the Under 16 boys and girls hit more fairways than the top pros do! The main tour has a much stiffer driving examination than the "lower" tours. This isn't just the courses that they play on, it's how the top tours set up for tournament week. The youngsters don't hit it as far of course but on average, hit considerably more fairways than the top pros. I've often told our young talents that "the pros would pay a LOT of money to be able to hit as many drives onto the short stuff as you do". Encouragement and taking the positives is way more important in my opinion than the "fault-finding" function of stats analysis. In this "game of never-perfect" and given that EVERY golfer - including in the world top 10 - has at least one area of their game that they can improve, it is counterproductive to overly-lament the bad stuff and focus exclusively on the negatives. The weaker areas are what to practise... and change if need be, without ever neglecting our strengths of course or indeed any part of our game (see next case example). The game can be hard enough without looking for and recognising the positives as and when they show themselves... and they do!
Example 2:
Our measurement platform examines performance by shot types as well as by clubs used, which is much more valuable in my experience. We can go deeper than the overall numbers and even deeper than the club categories. This was a text from a client this week: -
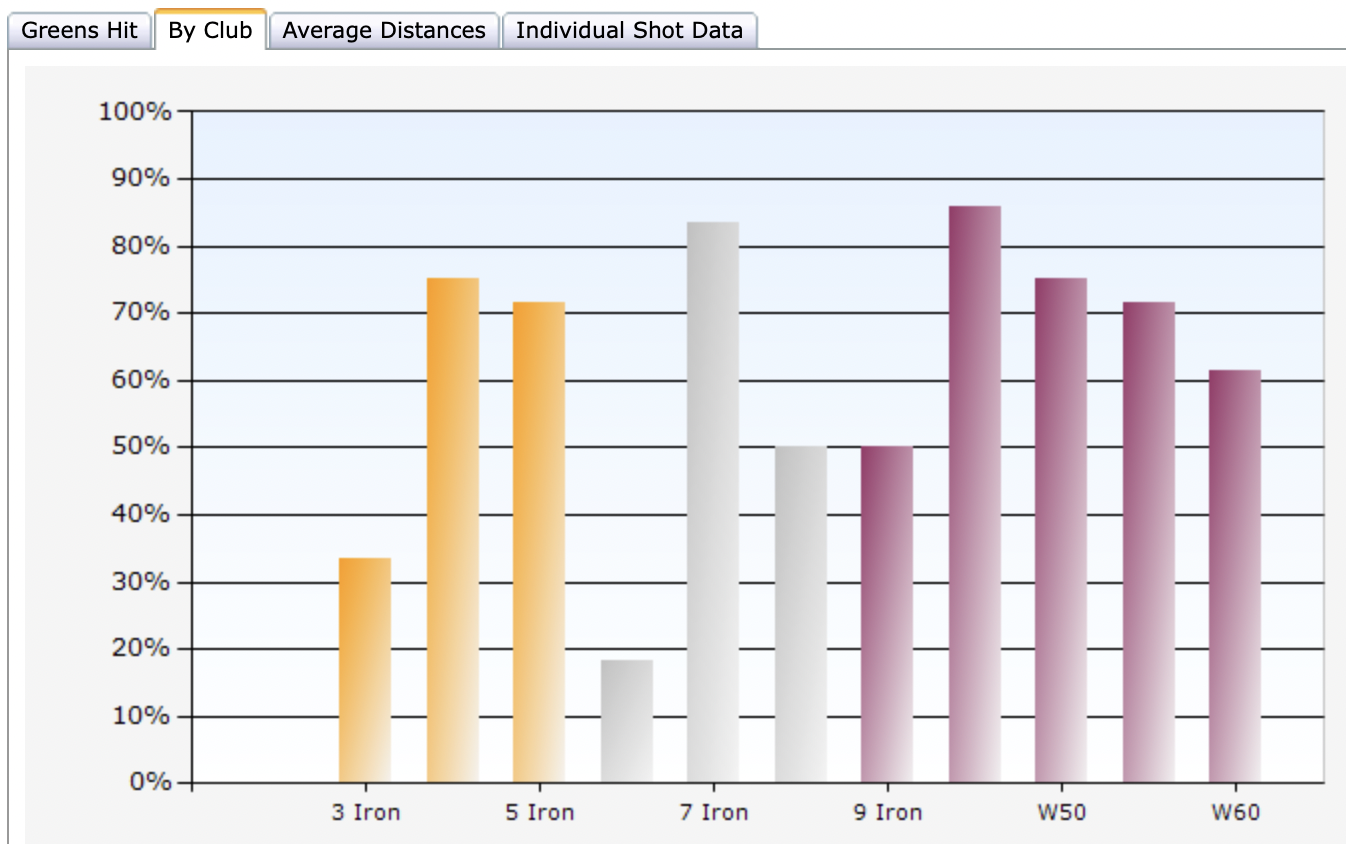
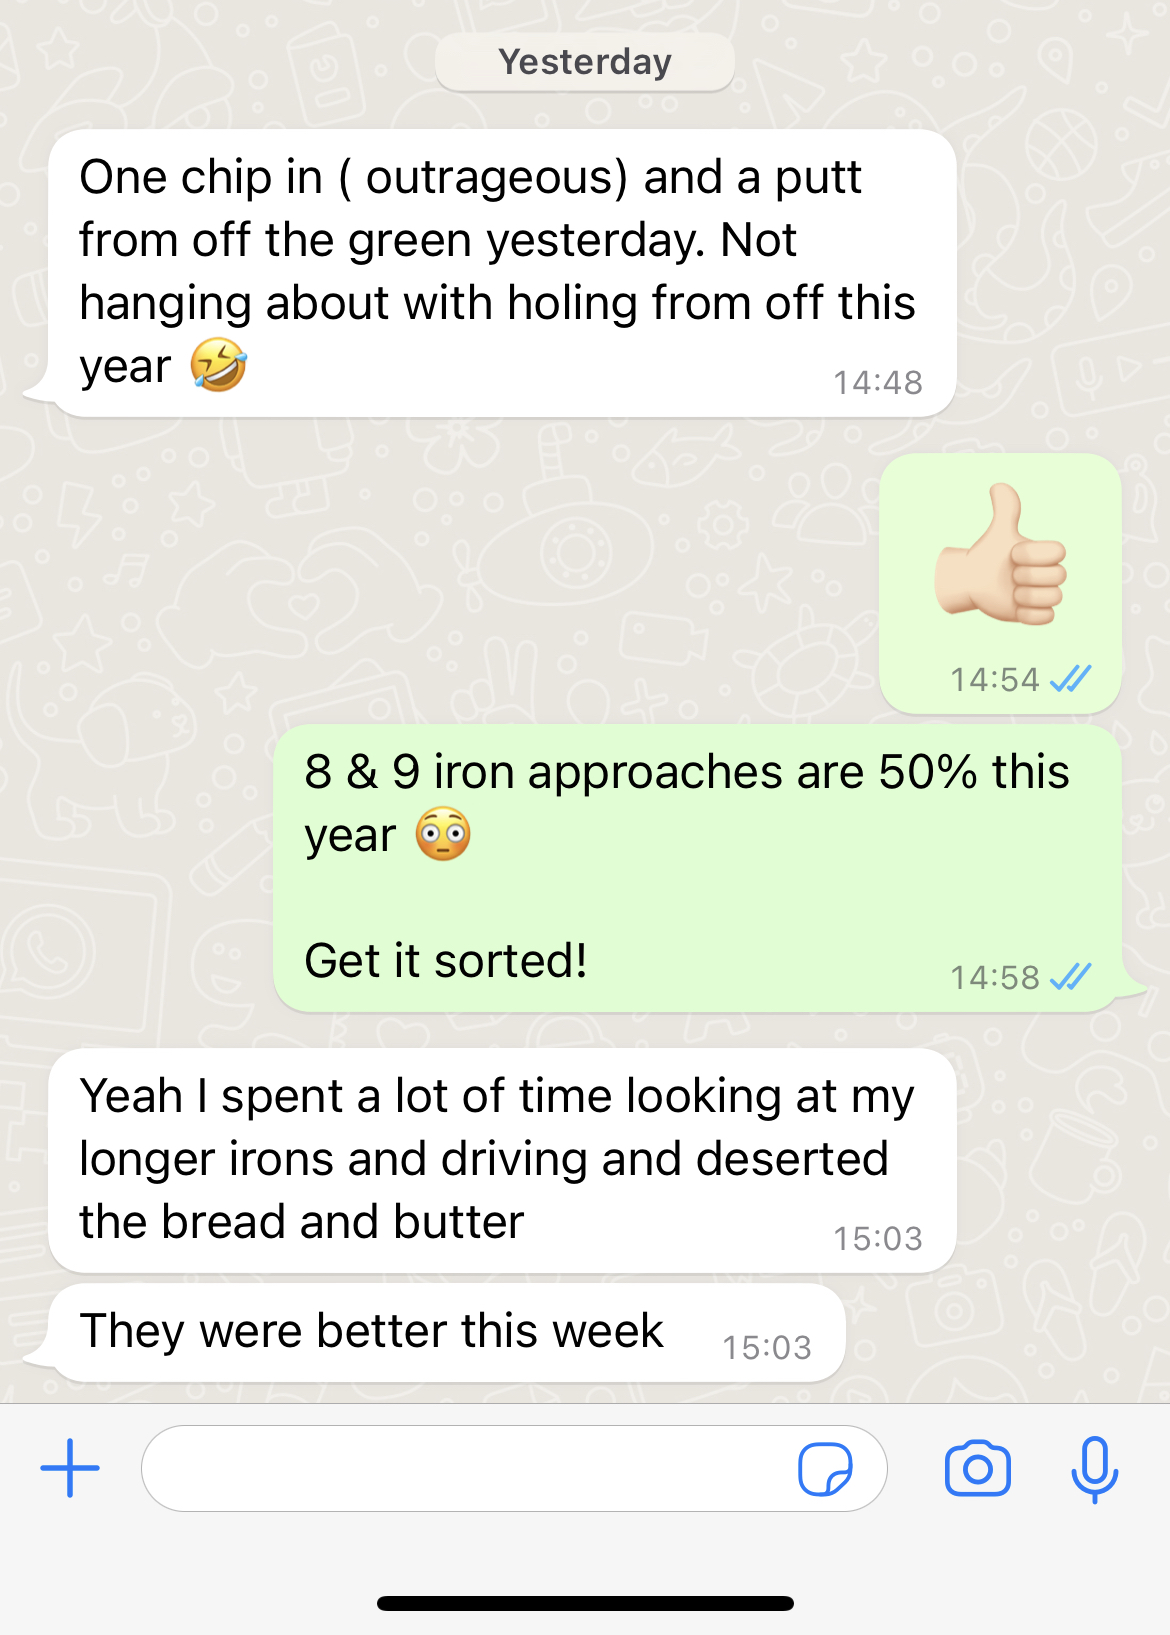 Just to contradict myself less than a couple of dozen words later (of this article) because I focused on the bad stuff rather than celebrating his excellent Short Game this YTD - he's a friend of mine and I'm sure he took it in the spirit intended - this is the data from his Approaches section for 2022 so far: -
 Of course we ALWAYS see blips in small data samples - and this year is not old enough yet to rack up a big and robust data sample - but it is interesting that the throwaway (and cheeky) comment I threw at him was something he could recognise and explain from his recent practise! It was also an example where looking deeper into the data revealed something that the Approach percentages, even by Medium and Short club categories, might have missed.
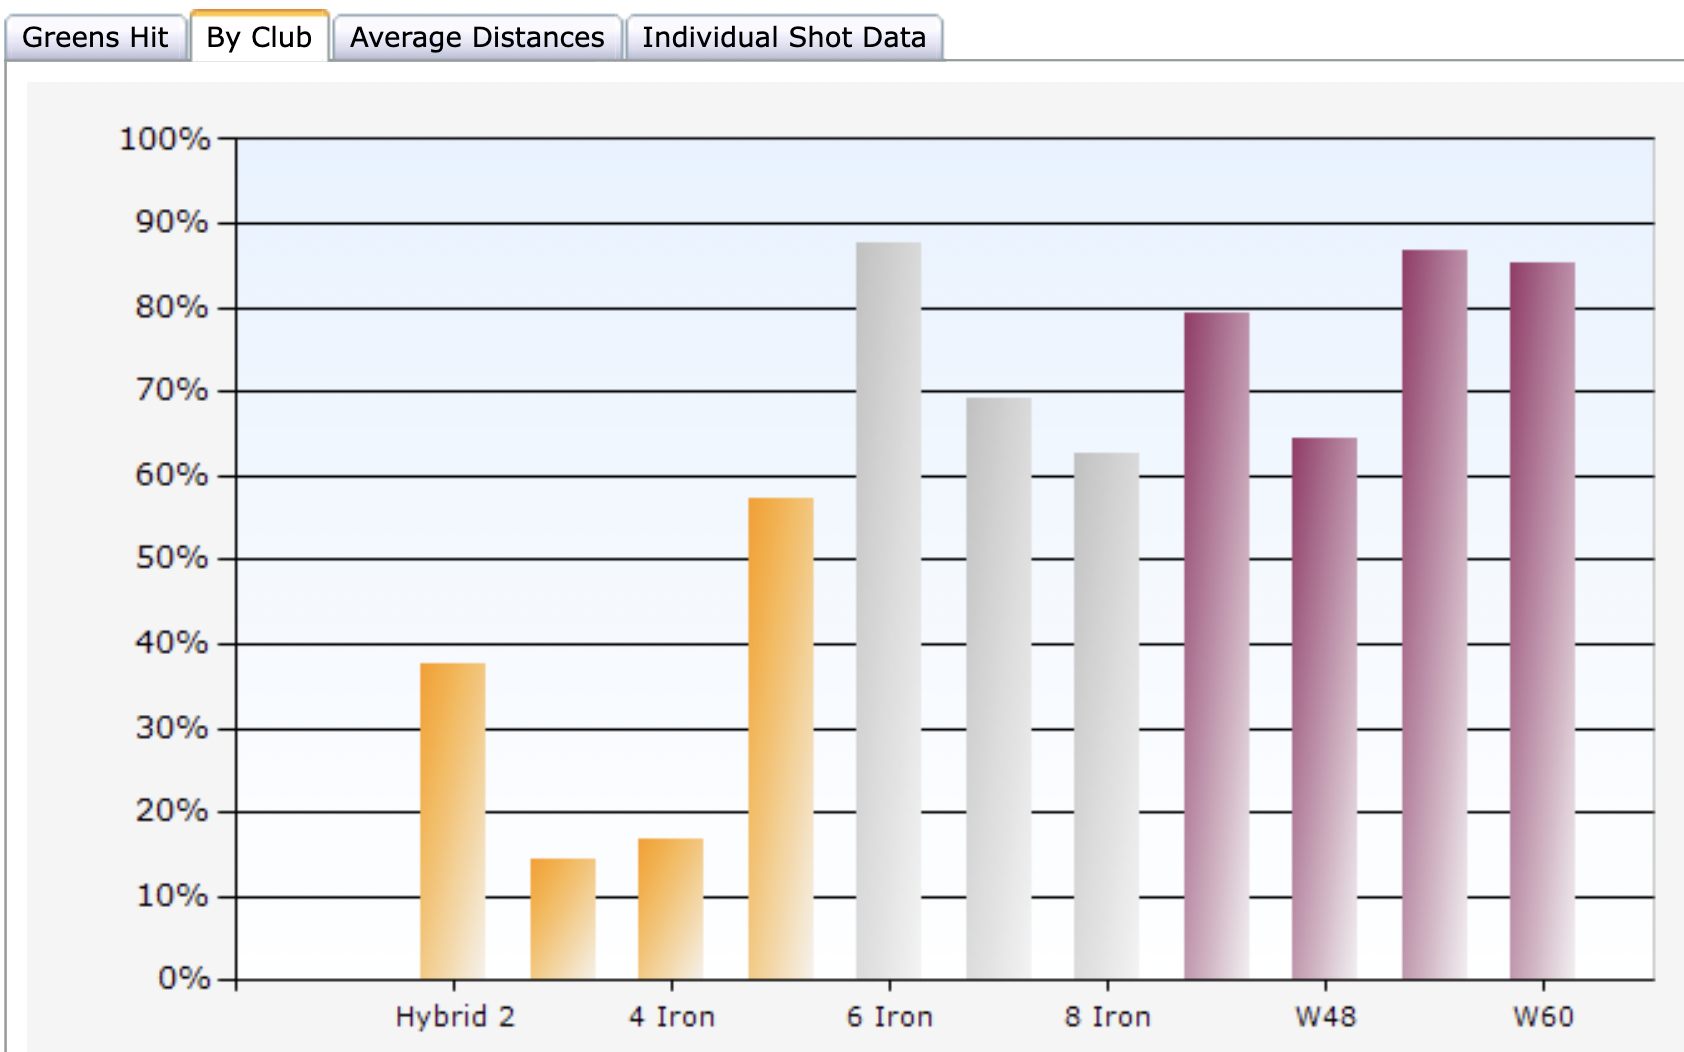
Look also at his 6 iron approaches this year. Only 2 greens hit and 9 missed is a lowly 18.2%. This will naturally correct itself as more rounds get added - he won his national championship despite being a working man with responsibilities rather than having the luxury of being a full-time amateur - but it reminds me of a pro client in his first year on GDL. He told me that he was still waiting on his first 6 iron approach to hit a green! He had seen in his stats that he had hit 10 x 6 iron approaches in his first few Rds recorded but had missed the green with all of them. "That's great", I said over lunch - after he and my mate had been soundly beaten at Panmure by me and a young amateur (mostly because of him of course, now an established tour pro with his first win on tour coming at 28 years of age, like Hogan) - "it means you've just identified a blip in your data". I explained to him that we will always see anomalies and blips in small data samples and obviously he isn't going to go another 10 x 6 iron approaches missing all the greens, 10 shots with one club being a tiny data sample in the overall scheme of things. He actually missed his next 6 iron approach as well so after his first 16 Rds recorded, was 0/11 with this club (approach shots only): -
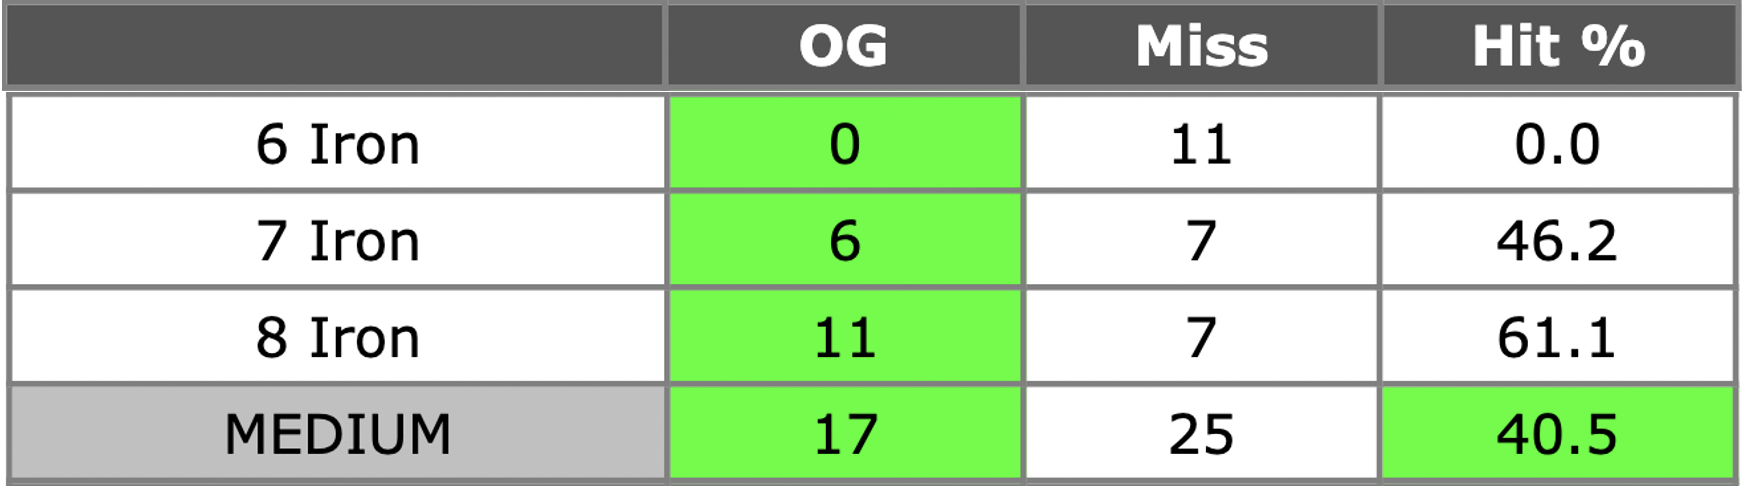 For his next 14 Rds on the Challenge Tour - a missed cut in France then 3 made cuts in Spain, Italy and Finland (this pro made his European Tour card twice in the years following) - the table had been turned with his 6 iron;
 He was now hitting a bigger percentage of greens with his 6 iron (approaches) than any other club in his bag!
There are reasons for this - aren't there usually always reasons, for everything? - and I will no doubt share with you "the Power of Persuasion" on these pages in the future but without data, without looking at it, without finding the mathematical quirks, blips and coincidences that it always throws up, it's pretty difficult to understand "what's really going on" (© Fontaines DC, Chequeless Reckless). Whether it's you, your coach, your stats analyst, your manager, your partner or your mum or dad looking at your numbers, there is much gold and many diamonds (information and knowledge) to be mined for.
Graeme Leslie
Golf Data Lab